

Capacity Meta Data in the KQL Engine
When working with the KQL database in Microsoft Fabric, the ability to see into the whereabouts of the KQL database’s consumption and usage of the Fabric Capacity can be helpful to understand performance issues and general usage of the compute engine.
In this blog post, I will guide you to understand the whereabouts of the capabilties on the KQL engine to look into the meta-data of the underlying compute, engine size and other meta-data to support your understanding of the specifics in the situation you are facing when working with the KQL engine.
A look into the past
As you might alreay know, then Microsoft has been building the Kusto engine for quite a long time now. Updating the functionality and capabilty throughout its current lifespan.
This Kusto engine is also supporting the usage of Eventhouses and KQL databases inside Microft Fabric. For every KQL database in a workspace, there is a service giving you the infrastructure and compute needed to perform the operations. This infrastructure is still based on the Kusto engine behind the scenes in Fabric. Even though you can’t access this service from the Azure portal, as you would any other Azure service, you can still query the engine’s meta data and understand the current settings and configuration of the database and cluster.
This Kusto engine has an extensive set of meta data queries you can use to explore the current status of your cluster and database.
The meta data queries
All of the meta data queries in the KQL language starts with a dot “.”.
Examples of these meta data queries are:
- .show
- .clear
- .purge
- .alter
- .drop
Each of these commands has their own set of following commands, and are merely queries against the underlying functions or views from the hidden metadata database which follows every Eventhouse in Microsoft Fabric. A database you cannot access directly, only through these metadata queries. In this blog post I will focus on the .show command.
Using .show to get insights of the Kusto cluster and database
The .show command contains a long list of elements to show. Here you can find elements like .show commands which can show you the latest maintennance commands executed on the cluster. .show continuous-exports which shows you all the defined continuous exports from the cluster. Many more commands to discover and play around with. Among this list is a few I would like to dive into details.
.show cluster
Executing this command by itself, will give you the details of the cluster. Here you will get intormation about the number of nodes in the cluster, number of processors allocated, the total memory available and the memory consumption, just to mention some of the details you get here.
An example of the results can be found below:
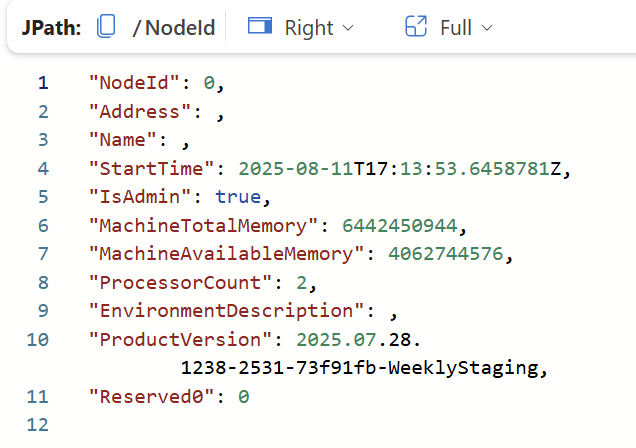
I have pasted in the JSON results, as they are easier to read in a blog post.
In my case I only have one single node on my cluster, as I have enabled autoscaling (the default setting in Real-Time Intelligence). If I needed more compute, the cluster would automaticcaly allocate more nodes and the result set would have more than one row. I could also force the cluster to have a bigger size, by altering the Evenhouse configuration in the “Always-on” setting. Here you will find a setting named “Minimum consumption” where you can set the minimum cluster size based on. From the below screenshot, you will also see that the Fabric UI recommends a size, based on the current usage.
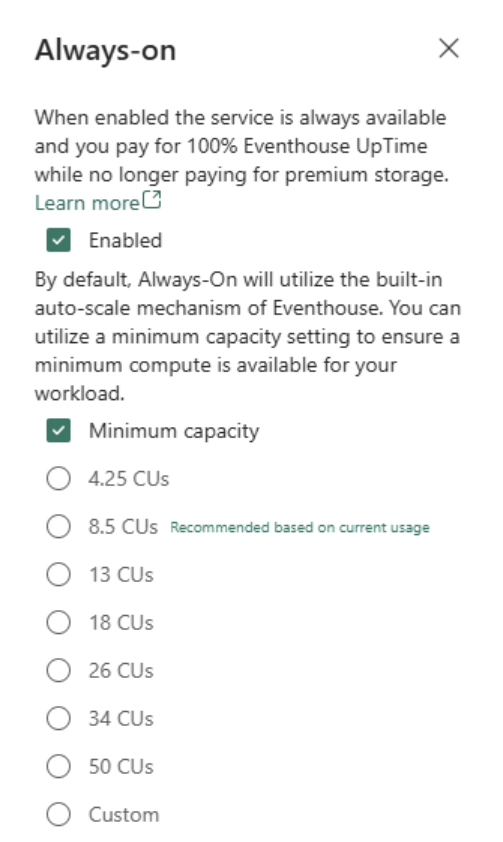
Each standard setting in the list comes with a set of configurations - e.g. the 18 CUs settig comes with around 4000 GB of free storage. For the full list of storage sizes you can see this list.
.show cluster extents
The .show cluster command has some additional views to query. First, let me dive into the .show cluster extents. This command wil give you the tables in your KQL database(s). The example below is one of the lines from the result set. Here you can see the TableName, the sizes Original, Extent and Compressed and the index, to mention some of them.
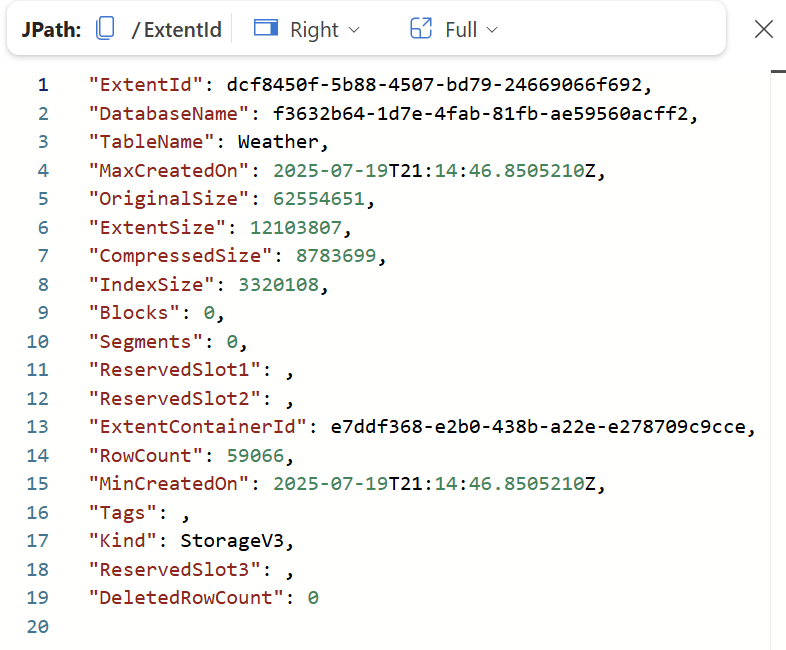
The sizes needs a comment - first of all the OriginalSize shows the size of the original data at ingestion time. So the raw size of the data before storage in the database. The ExtentSize is the physical size of the table on disk. This does not have to be all data, it can also be reserved space on the disk to have room for more ingestion. CompressedSize is the actual size of the data on disk. From these numbers we can see in this particular table that I have a compression rate of: 62.554.651 / 8.783.699 = 7,12. So every time I load 7,12 MB of data to this table, I am only storing 1 MB psysically on disk. One of the big benefits of using the Kusto engine, is the ability to compress the data and create an index. The index size is around 3,3 MB.
.show cluster schema
.show cluster schema can be quite handy when working with the metadata of the databases, as it returns the complete schema of the databases, including the table names, column names and their respective data types. En example is shown below.
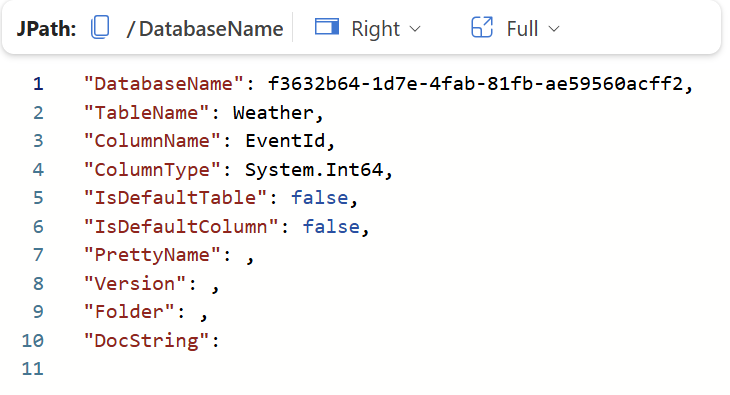
From the above screenshot, you also see a column named “PrettyName”. This is the translation of the field DatabaseName, which isn’t the name, but the autogenerated internal id for the database. The PrettyName is merely a given metadata name for the database.
.show cluster monitoring
This view contains some interesting information. Let’s start with an example.
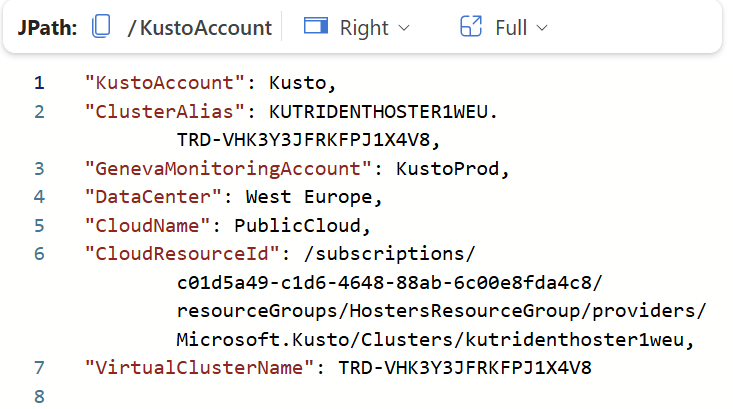
Here we can see the details of the cluster as if we were looing inside the Azure portal. We get information on the region (Data center), the ClusterAlias - this is the internal cluster where this specific Eventhouse is stored. Notice here that we see the “trident” name in the details here. In caes you have missed it, then Fabric was named Trident as the working title and project before release. We also see the internal cloud ressource id, as it would look if we has control over the infrastructure from the Azure portal.
As many services in Microsoft Fabric, they have an equivalent matching service in Azure. Though we cannot access them, sometimes we can get a glimpse of them from some of the settings and metadata discovery we can do.
.show databases
The .show databases command also comes with some interesting information. Here we can see the PrettyName again, but also the “PersistentStorage” address.
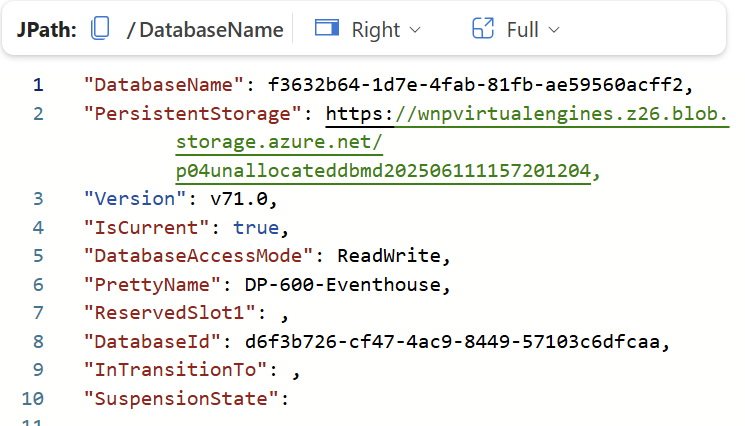
The address “https://wnpvirtualengines.z26.blob.storage.azure.net/p04unallocateddbmd202506111157201204" is the address for the persistent storage account which follows this Eventhouse. Again we cannot access this, for good reasons.
.show capacity
This query will show you the current cluster’s capacity in the current scalig setting and configuration. We see from the below screenshot, that for instance, we have possibility of configuring 5 graph snapshots, before the engine will try to scale up. The same is seen with the “Queries” setting, here we can use 20 parallel queries before the engine will try to scale up.
External links
Some of the information you have just learned, is also available from the Fabric UI - please see the following list of links to read more:
- UI access to some of the metrics from Microsoft Learn to read more.
- Eventhouse monitoring
- Command logs
Summary
In this post, we’ve explored the powerful metadata queries available in the KQL engine within Microsoft Fabric. While Fabric abstracts away the underlying infrastructure, these queries provide a crucial window into your KQL database’s operational details, performance, and configuration. We focused on the .show command and its various sub-commands, which allow you to:
Inspect Cluster Health: Use .show cluster to see details like the number of nodes, memory usage, and processor allocation, which are vital for understanding your compute resources.
Analyze Data Storage: The .show cluster extents command provides granular insights into your data’s size and compression rates, helping you optimize storage and understand how much physical space your data is consuming.
Understand Schema and Structure: With .show cluster schema, you can quickly get a complete overview of your databases, tables, and column data types, which is invaluable for development and maintenance.
Gain Operational Insights: Commands like .show cluster monitoring and .show databases reveal behind-the-scenes information, including the cluster’s region, internal IDs, and the persistent storage location, offering a glimpse into the Azure services powering your Fabric experience.
Evaluate Scaling Capacity: Finally, .show capacity helps you understand the current scaling limits and configurations of your cluster, such as the maximum number of parallel queries, giving you a clear picture of when the engine might scale up to handle increased load.
By leveraging these metadata queries, you can gain a deeper understanding of how your KQL databases are performing and consuming capacity, enabling you to troubleshoot issues and optimize your Fabric environment more effectively.
Don’t forget to subscribe to the newsletter to get the next blog post directly in your inbox.
Free Microsoft Workshops
![]()
Subscribe to my channel
")
")