

Geospacial functions in KQL
Among other awesome features in the KQL language and engine, you also get a very strong set of features and functionality around geospacial data, calculations and visualization.
This post will give you the introduction and a set of examples on how to work with geospacial data in KQL.
The strengh of geospacial in KQL
The Kusto engine and the KQL language has an extensive library and functionality when working with geospacial data. The engine, given the “everything is indexed” approach, is very fast at getting the data from the tables. This fact and the added functionality to the KQL language, give you every possibility to do what ever you need with the geospacial data.
Here are some examples of usage with the geospacial functions:
- Calculate the distance between two points in the world - both streight line and shortest distance (for ex. flying)
- Calculate the intersection between two vectors, where does the two lines cross
- Calcualte the area of a given polygon
- Calculate the center of a given polygon
- Translate from latitude and longitude to S2 cells and H3 cells
- …and much more
To get the full list of capabilities from the Kusto laguange, you can read the Microsoft documentation right here.
Example scripts
Here is a list of examples on how to use the geospacial functions.
Distance calculation
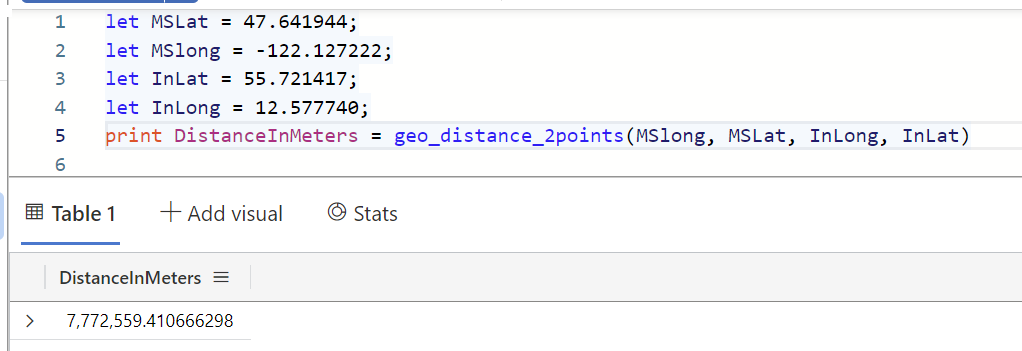
Let’s take an example of two points in the world - Microsoft campus in Redmond and my employer here in Denmark, Intellishore.
Microsoft (lat,long): 47.641944, -122.127222
Intellishore (lat,long): 55.721417, 12.577740
let MSLat = 47.641944;
let MSlong = -122.127222;
let InLat = 55.721417;
let InLong = 12.577740;
print DistanceInMeters = geo_distance_2points(MSlong, MSLat, InLong, InLat)
Above gives us the distance in meters between the two points.
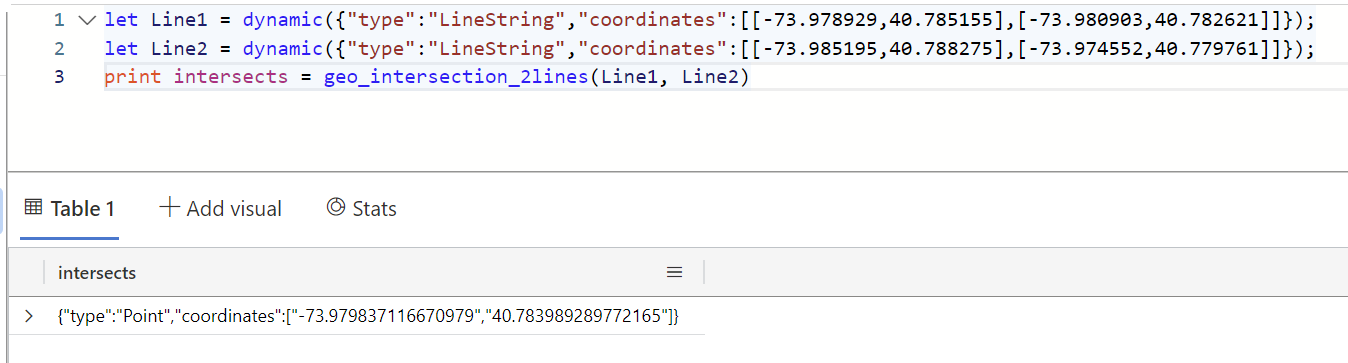
Intersection of two lines
Given two different lines in the world:
Line1: [-73.978929,40.785155],[-73.980903,40.782621]
Line2: [-73.985195,40.788275],[-73.974552,40.779761]
let Line1 = dynamic({"type":"LineString","coordinates":[[-73.978929,40.785155],[-73.980903,40.782621]]});
let Line2 = dynamic({"type":"LineString","coordinates":[[-73.985195,40.788275],[-73.974552,40.779761]]});
print intersects = geo_intersection_2lines(Line1, Line2)
Get H3 polygon from a latitude and longitude
The H3 polygon standard is developed by Uber to have a system for ride optimization and other features like dispatching and ride pricing. Read all bout it [here] (https://www.uber.com/en-DK/blog/h3/).
The system is dividing the surface of the earth in hexagonal areas with a hierarchy of areas in each hexagon. The system has 16 levels, from 0 to 15. With level 0 with an edge length of 1.108.000 m and level 15 with an edge length of 0.5 meters.
The dataset defined by this statement:
datatable(lng:real, lat:real)
[
    -73.956683, 40.807907
]
| project h3_hash = geo_point_to_h3cell(lng, lat, 6)
| project h3_hash_polygon = geo_h3cell_to_polygon(h3_hash)
| summarize h3_hash_polygon_lst = make_list(h3_hash_polygon)
Can give us these polygons to draw:
|
|
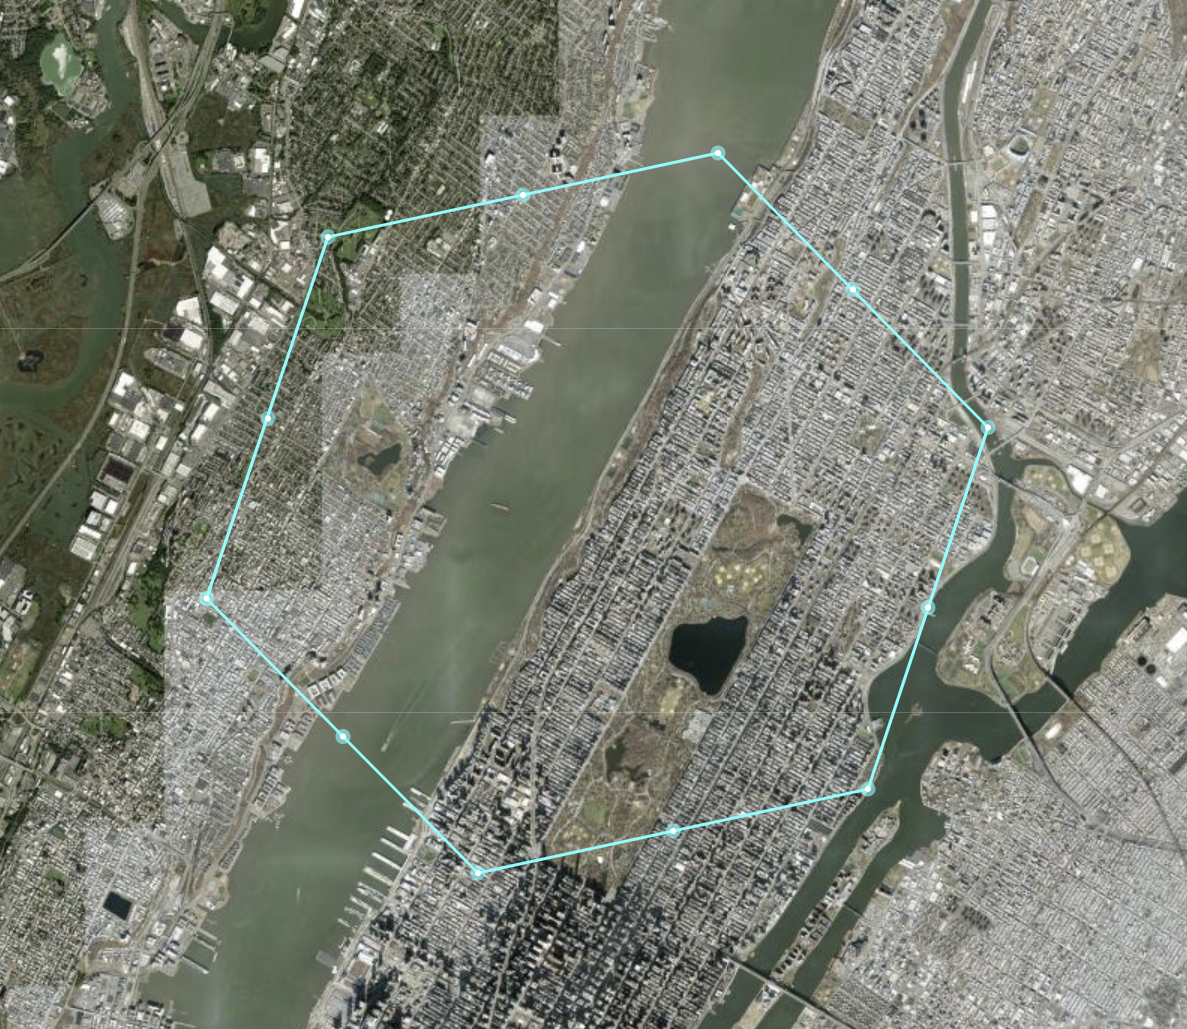
I’ve used the keene.edu website to draw the polygon
and let me try to calculate the center of this polygon
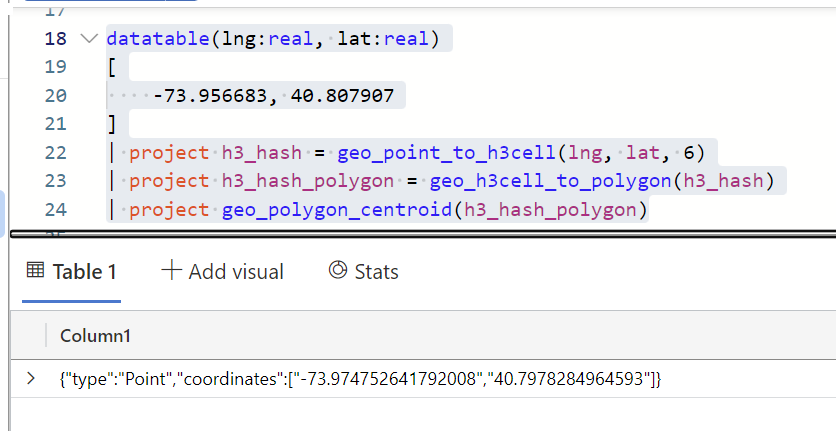
datatable(lng:real, lat:real)
[
    -73.956683, 40.807907
]
| project h3_hash = geo_point_to_h3cell(lng, lat, 6)
| project h3_hash_polygon = geo_h3cell_to_polygon(h3_hash)
| project geo_polygon_centroid(h3_hash_polygon)
Above KQL statement gives me this output:
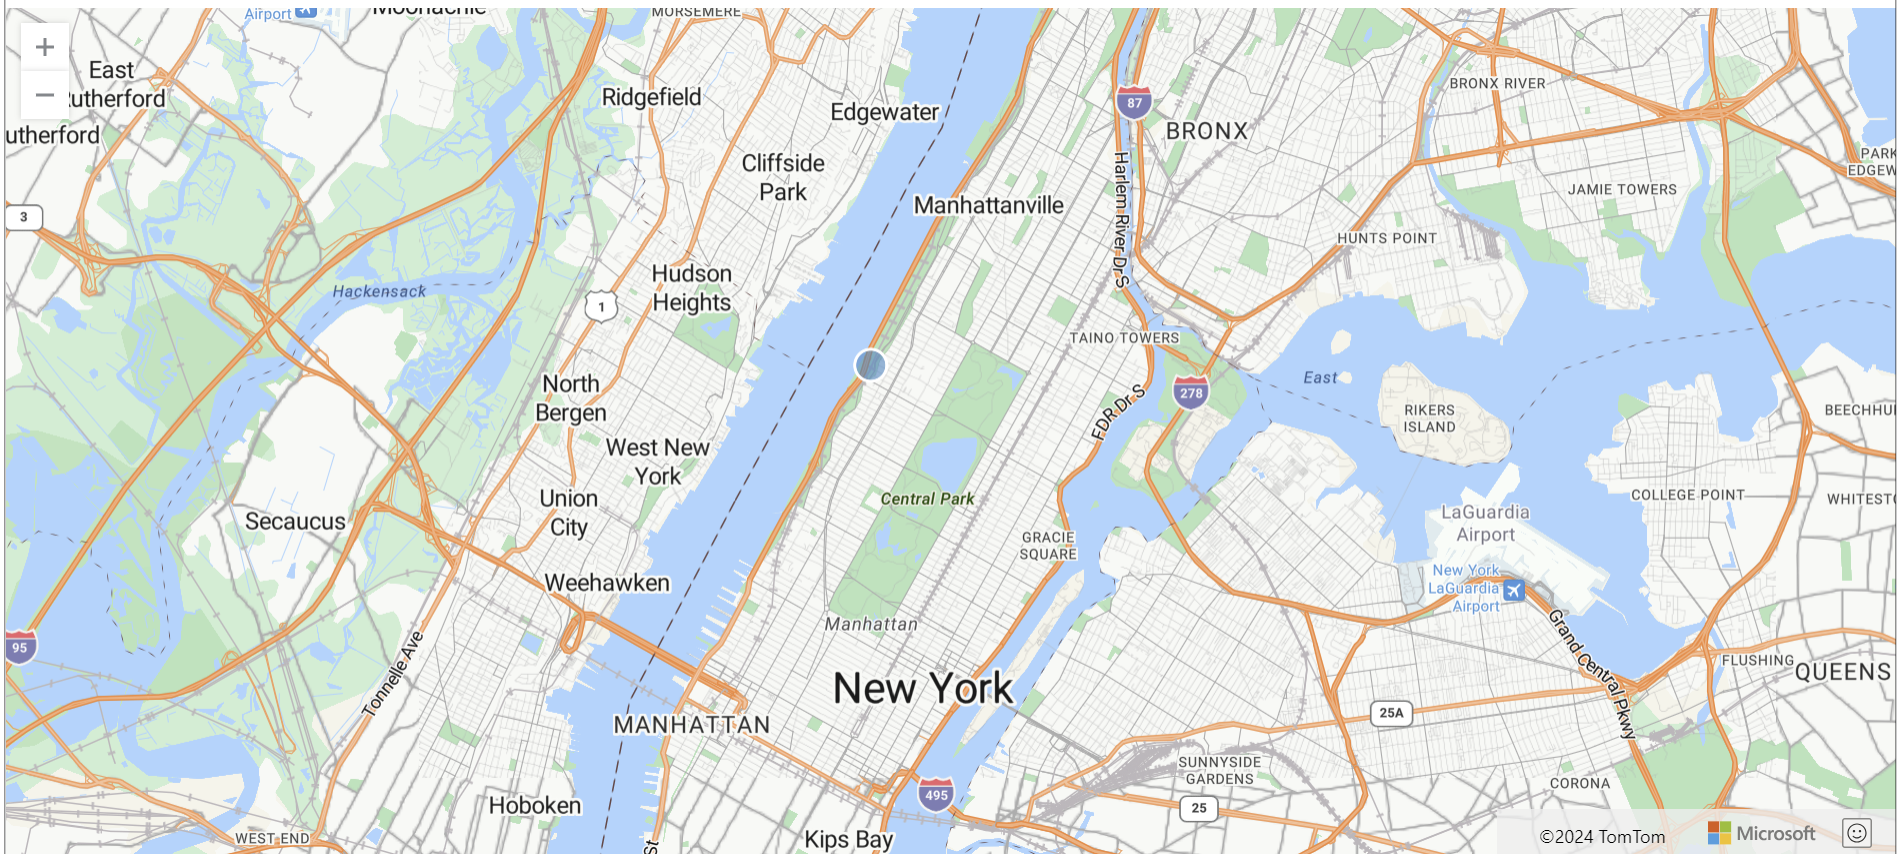
Draw it on a map directly using KQL is possible by adding this line to the end of the above statement:
| render scatterchart with (kind=map)
datatable(lng:real, lat:real)
[
    -73.956683, 40.807907
]
| project h3_hash = geo_point_to_h3cell(lng, lat, 6)
| project h3_hash_polygon = geo_h3cell_to_polygon(h3_hash)
| project geo_polygon_centroid(h3_hash_polygon)
| render scatterchart with (kind=map)
Get started your self
With above introduction, I hope you can see how accesible it is to get started with the geospacial functions and capabilities in the Kusto engine using the KQL language.
As stated above, the Microsoft Learn site has all the needed information for you to get started. You can find it here.
Remember to sign up to the newsletter to get new blog posts directly in your inbox.
Free Microsoft Workshops
![]()
Subscribe to my channel
")
")