Real-Time Intelligence news from Fabcon Stockholm
The FabCon conference in Stockholm has ended, and we got a lot of news from the products teams around Real-Time Intelligence.
Here is my rundown of what’s new and how it changes the work with the suite around RTI.
Copilot - again
We really begin to see the Copilot offering from Microsoft be implemented in a lot of services - and Real-Time Intelligence is not missed.
We have had the Copilot for KQL for a while now, and the latest addition is the ability to create a Real-Time Dashboard using Copilot.
From each table in the Real Time Hub, we can now get Copilot to help us create a Real-Time Dashboard with one click.
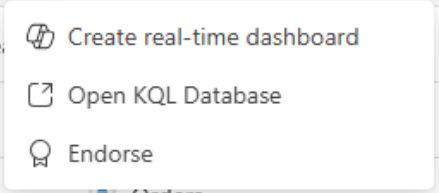
Some might ask: “why onky one table, and not a set of tables?”. Here is where the engine’s power come to play. It is way more effecient to do reporting in Eventhouse (the KQL engine) using only one table. No need for data modelling or star schema work. Just put everything in one broad table. It will be fine.
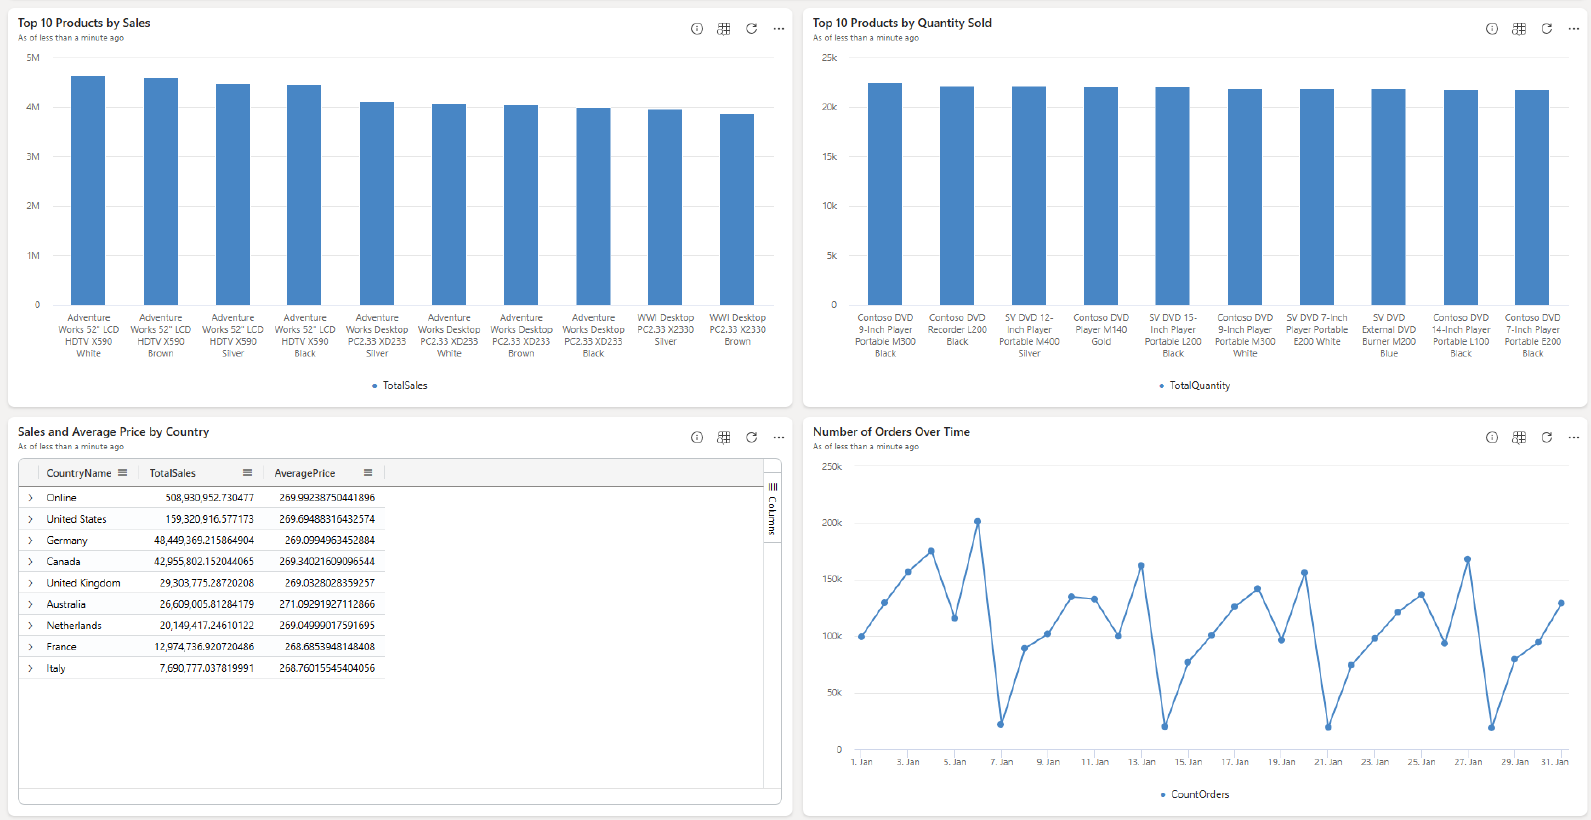
When using this option, the output is two pages. One page with insights and analytics on the data from the table.
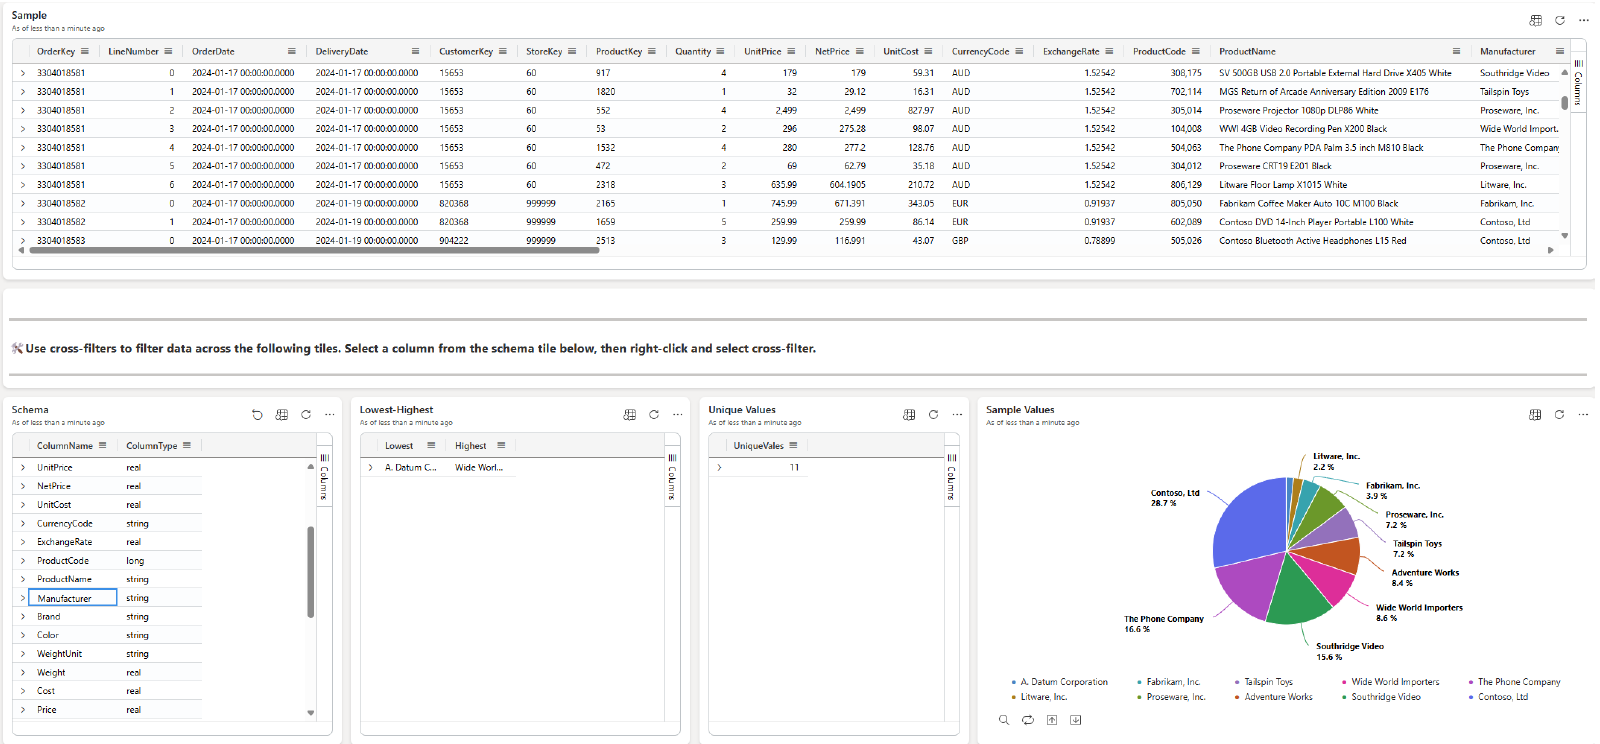
And a second page with some meta data for that specific table - sample data set, column data types and a pie chart(?!). Why oh why a pie chart? I can think of at least a few other visualizations that could be more readable than a pie chart. I hope this will change in the future.
Creating a Dashboard is one of the new things around Copilot and RTI. We also now have a more conversational usage of Copilot in RTI. Prior to this update, we did not have any connection between the questions in the flow. A second question to Copilot around KQL did not make sure to take the first question and answer into account.
Now the engine is conversatioal aware, and uses the entire conversation to keep the questions and answers connected where needed. A huge addition to the existing KQL in Copilot option for Fabric.
Real-Time Dashboard to apps in Power BI
With the release of the Real-Time Dashboard in Real-Time Intelligence, we got a second option to visualize data from the Eventhouse service in Fabric. We can build dashboards and analytics directly on top of the data using KQL statements and get insights to the data outside of Power BI.
Now - the Real-Time Dashboard option can be a part of the apps in Power BI. This extends the Power BI app with the fourth option nest to Power BI reports, Power BI paginated reports and Notebooks.
The availability we get now, is to create an app as we are used to, and now we can add a Real-Time Dashboard tile to a page.
Real-Time Dashboard lower refresh rate
The Real-Time Dashboard feature had a minimum refresh rate of 30 seconds - just like Power BI.
Now we have more options to get data refreshed in the dashboard. Continuous and 10 seconds. This is also a big ask from the clients I’ve been working with, and a missing link on why they should use the Real-Time Dashboard over Power BI.
With both options, and the first ones, for refresh rates, consider that each time a refresh is made, the KQL database is alive and returning data to the dashboard. This might cost a bit more on the CU consumption and something that needs to be tested.
New connectors to Eventstream
We also got four new connectors to Eventstream - giving us the ability to read data from the following sources:
- Azure SQL Managed Instance Database (change data capture)
- SQL Server on Virtual Machine (change data capture)
- Apache Kafka
- amazon MSK Kafka
This adds new functionality to the Eventstream processor and makes it possible to read even more data sources directly to Eventstream without a “service in the middle” to grab, translate and send the messages forward.
Managed Private Endpoint for Eventstream
A long asked wish from the clients I’ve been working with. We can now read data through a vNET and connect to other services, like Azure Event Hub, Azure Event grid or other services outside of the vNET.
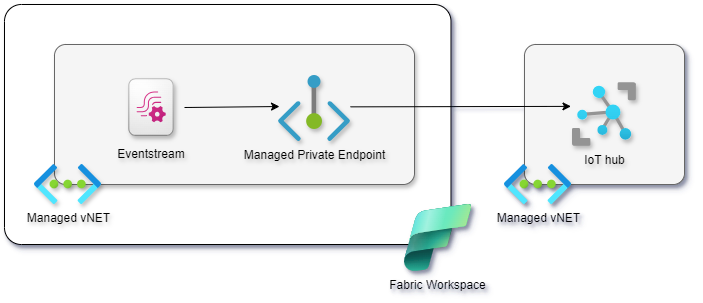
This adds to the existing functionality of the vNET in Fabric and gives us extended usage for situations where a managed private network is enabled and needs to be used.
A new UI experience in Real-Time Intelligence
We also got a new look and feel of the entire Real-Time Intelligence suite. For the KQL Database and the Real-Time Hub.
The KQL database new UI
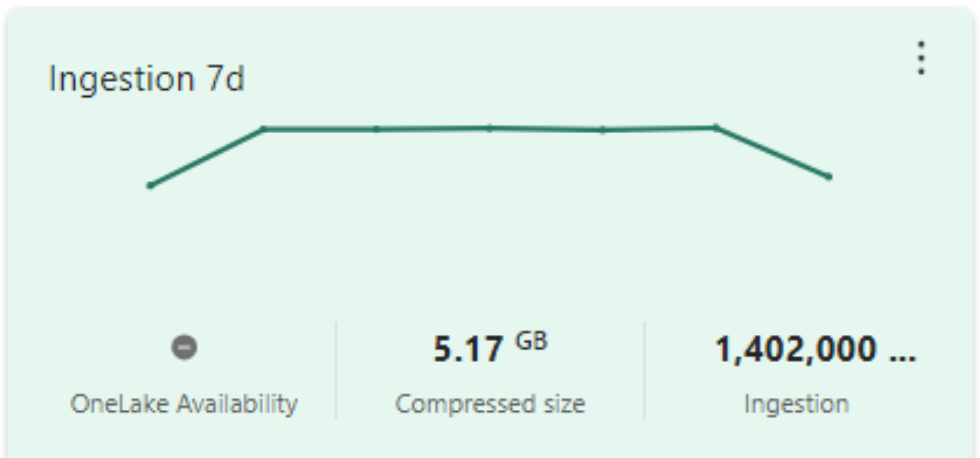
The KQL database from the Eventhouse has been freshened up and given a high level overview of the data from the tables.
When opening an Eventhouse you instantly get access to an overview of each table giving you information of ingestion speed over time, size of the table and how many row has been ingested over time. A OneLake availabilty info is also present.
Real-Time Hub new UI
The user interface and interaction in the Real-Time Hub as gotten a makeover. The top menu has moved to the left and holds the same items as before, with an additional option of “My streams” which holds the Fabric items for streaming which exists in My Workspace.
Along with a few other UI updates, the look and feel of the Real-Time Intelligence experience is now on a next level and really easy to use and catchy for the eyes.
For a full list of Real-Time Intelligence releases from the FabCon conference - please see this link
Round up
I think we got a great list of news from the FabCon conference in Stockholm around Real-Time Intelligence. I have not listed all of them here, and you will find more information around the big internet on all the news.
I hope you liked this installment and please remember you have the option to subscribe for a mail alert, when a new post is published. Just use the sign-up form in the footer.


